Nonlinear
Advertisement
EASY-FIT Express v.1.0
The software system solves constrained nonlinear parameter estimation problems. Synonyms are data fitting, nonlinear regression, parameter identification, curve and surface fitting.
Advertisement

EqPlot v.1.3.22
EqPlot plots 2D graphs from complex equations. The application comprises algebraic, trigonometric, hyperbolic and transcendental functions. EqPlot can be used to verify the results of nonlinear regression analysis program.
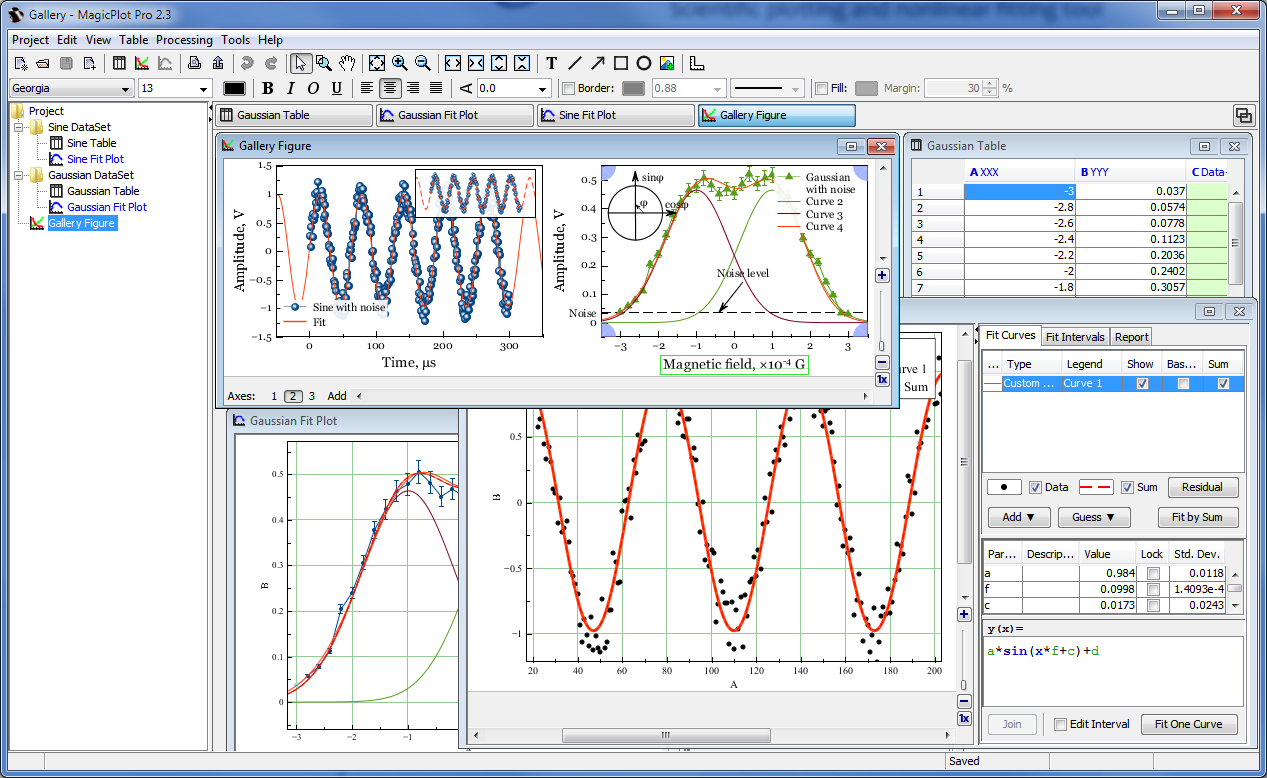
MagicPlot Student v.2.3
MagicPlot is an easy to use program for scientific and engineering data analysis, graphing and nonlinear curve fitting. MagicPlot provides publication-quality graphs. It is fast, lightweight and does not need installation.

DataFitting v.1.7.22
DataFitting is a powerful statistical analysis program that performs linear and nonlinear regression analysis (i.e. curve fitting).
MagicPlot Student for Mac OS X v.2.3
MagicPlot is a handy tool for scientific and engineer data processing, plotting and nonlinear fitting.
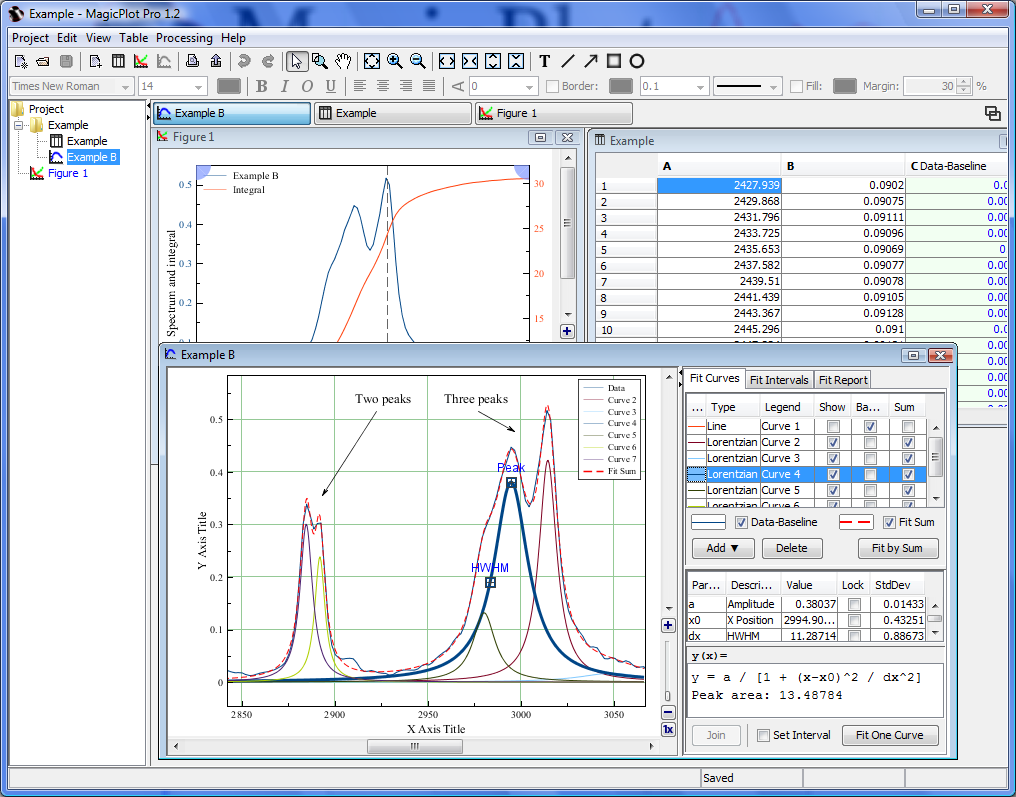
MagicPlot Pro for Mac OS X v.2.0
MagicPlot Pro is a handy tool for scientific and engineer data processing, plotting and nonlinear fitting.

Equation graph plotter - EqPlot v.1.3.33
EqPlot plots 2D graphs from complex equations. The application comprises algebraic, trigonometric, hyperbolic and transcendental functions. EqPlot can be used to verify the results of nonlinear regression analysis program.
XLSTAT (Win)
XLSTAT is a complete analysis and statistics add-in for MS Excel. It includes regression (linear, logistic, nonlinear), multivariate data analysis (PCA, DA, CA, MCA, MDS), correlation tests, parametric tests, non parametric tests, ANOVA, ANCOVA and much

MagCAD - The magnetic field calculation software
MagCAD is a simple low-cost software tool for calculation (computation, modeling) of spatial distribution of the magnetic field created by permanent magnets and electric coils at presence of nonlinear ferromagnetic materials in cylindrically symmetrical

Equation Plotter - EqPlot
Graph plotter program plots 2D graphs from complex equations. The application comprises algebraic, trigonometric, hyperbolic and transcendental functions. EqPlot can be used to verify the results of nonlinear regression analysis program. Graphically
Regression Analysis - DataFitting
DataFitting is a powerful statistical analysis program that performs linear and nonlinear regression analysis (i.e. curve fitting). DataFitting determines the values of parameters for an equation, whose form you specify, that cause the equation to best